我們曾在:如何讓主機的防火牆csf不會誤擋到ftp,討論其ftp和防火牆的相關設定。
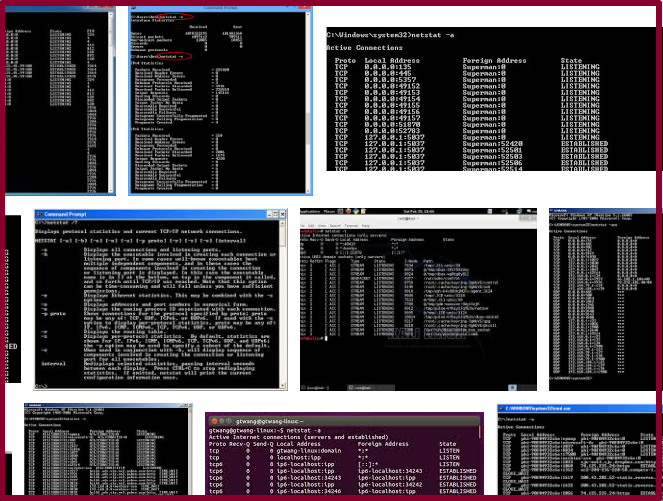
如果進一步了解linux server的port運作(傳輸層,與應用層),就可以使用netstat指令。
閱讀全文 如何查看linux server連線port是否異常?
標籤: linux
如何檢測 Unix /Linux 的 Bash Shell 漏洞
Unix /Linux 的Bash Shell 出現重大漏洞
關於Unix /Linux 的Bash Shell的漏洞問題,
原文出處: http://www.ithome.com.tw/news/91107
這邊就不在累敘,下列是相關OS的解法:
如何快速調查檔案及資料夾所使用的容量
這篇教學,其實是我們針對unethost.com虛擬主機用戶所提供的,unethost.com的虛擬主機有搭配使用cpanel控制台,並有檔案總管的功能可使用,但唯一缺乏的指令,就是查看每個資料夾所使用的容量,以做空間容量的調節使用。
請參考我們下列說明:
cpanel主機下,設定不同的帳戶可以共用資料夾
收到了客戶的要求,希望在他所租用的獨立主機下的二個account,A和B,有共用的資料夾。也就是說:
/home/A/public_html/share
/home/B/public_html/share
這兩個資料夾,是指到同一個位置。
本來我以為,只要用ln -s來建softlink,就可以把問題解決了。結果卻失敗了,softlink所在的那個帳戶,用ftp登入後,看不到share這個資料夾。這是為什麼呢?原因是在這邊,它寫說,symbolic link只能指向「正確的」的地方。使用者的ftp帳戶基本上是一個被chroot的環境,所以當然不能去看到別的使用者的檔案。
A symbolic link is a pointer to the “right” file. But if that original file is outside the jail then you can’t access it. This is the goal of a jail. Otherwise a normal user could create a symbolic link in the jail to/etc/passwd and just read it. What a security risk!
So jailed is jailed. Probably a hard link will do the job, as this is a “copy without duplicating the used size”. And for the FTP server it is like a normal file (with all the problems).
那麼,這樣的問題該如何處理呢?用 mount –bind來處理吧。這個是正確的作法。
mkdir /home/website/files/
mount –bind /home/shared/files /home/website/files/
像這樣子的作法,shared這個使用者ftp登入後,就看得到 website這個使用者的資料夾files了。因為 /home/shared/files 和 /home/website/files是同一個資料夾。
用linux的top指令來抓出主機的效能瓶頸
我在Cloudlinux的網站看到的教學文。對於常常在抓linux的效能瓶頸的我,相當有幫助。linux的top指令,是常用的好東西,只是它給的資訊很多,沒有經驗的人很難立刻理解。從範例中來理解是最好的。
(*) example 1:
top – 01:49:59 up 49 min, 5 users, load average: 18.02, 32.55, 34.91
Tasks: 269 total, 1 running, 268 sleeping, 0 stopped, 0 zombie
Cpu(s): 0.4%us, 0.6%sy, 0.0%ni, 16.7%id, 82.2%wa, 0.0%hi, 0.0%si, 0.0%st
Mem: 8028612k total, 2268460k used, 5760152k free, 88348k buffers
Swap: 4192924k total, 731688k used, 3461236k free, 309828k cached
PID USER PR NI VIRT RES SHR S %CPU %MEM TIME+ COMMAND
8842 mysql 11 -10 1274m 178m 4076 S 0.0 2.3 0:46.40 mysqld
機器跑得很不順 ( 因為load已經上來了,居然有到18 )
發現 Cpu 82.2%wa —> I/O wait
—-> 因為io busy的process通常也是cpu busy,所以直接看第一行。
—-> 八成是第一行的process把cpu cycle 吃太多了
—-> 第一行就是 mysqld
喔,這個很正常,mysqld只要config不對,就容易有這種問題。
到mysql去找問題吧。
(*) example 2:
01:15:52 up 15 min, 4 users, load average: 28.37, 20.02, 10.44
Tasks: 762 total, 1 running, 760 sleeping, 0 stopped, 1 zombie
Cpu(s): 0.5%us, 1.8%sy, 0.0%ni, 0.0%id, 97.3%wa, 0.0%hi, 0.4%si, 0.0%st
Mem: 8028612k total, 7981536k used, 47076k free, 34512k buffers
Swap: 4192924k total, 2894460k used, 1298464k free, 272708k cached
機器跑得很不順 ( 因為load已經上來了,居然有到28 )
發現 Cpu 97.3%wa —> I/O wait
此外,還發現一件事: swap 被用掉了3G,mem幾乎被用光了
—-> 八成是有一隻process把ram吃光光了,是誰呢?
—-> 按shift +m
—-> 第一行就是吃最多ram的process
(*) example 3:
top – 01:27:59 up 31 days, 22:31, 3 users, load average: 2.36, 2.33, 4.96
Tasks: 697 total, 1 running, 692 sleeping, 0 stopped, 4 zombie
Cpu(s): 2.1%us, 1.2%sy, 0.0%ni, 50.9%id, 45.5%wa, 0.1%hi, 0.1%si, 0.0%st
Mem: 4023964k total, 3917884k used, 106080k free, 298548k buffers
Swap: 8385920k total, 504136k used, 7881784k free, 1557260k cached
機器的load沒有衝高,然而,io wait 還是不低 45.5% 。swap雖然有被用到了,但是還小於0.5G,小事啦…,mem也還剩不少 ( 不是ram的問題 )
雖然cpu busy的process 通常也是io busy,但是,目前這種情況無法直接確定
所以top的第一行,cpu用最多的process,就一定是io用最多的。
所以這種時候,會需要另一隻程式 iotop,直接殺向io bound的process,找出效能瓶頸。